

Choosing the right data visualization tool can significantly impact your business performance, analytics efficiency, and ease of reporting. Tableau and Power BI stand out as the two industry-leading solutions in data analytics, visualization, and business intelligence. Both are powerful, innovative, and user-friendly—but which one is better adapted to your needs in 2025?
In this in-depth Tableau vs Power BI guide, I'll compare key aspects, provide actionable insights, practical examples, anecdotes, and resources to help you confidently choose the ideal tool.
Table of Contents
- Understanding Tableau vs Power BI: An Overview
- Detailed Feature Comparison: Tableau vs Power BI
- Pricing Structure Analysis: Tableau vs Power BI
- Community and Support Availability: Tableau vs Power BI
- Real-World Use Cases: Tableau vs Power BI
- Final Verdict: Tableau vs Power BI - Choosing Your Ideal Solution
Understanding Tableau vs Power BI: An Overview
Choosing between Tableau and Power BI is one crucial step towards data-driven success. Tableau has long been favored by data analysts and visualization specialists, known for amazing visual dashboards and extensive analytical capabilities.
Power BI, developed by Microsoft, quickly ascended in recent years, integrated perfectly within the Microsoft ecosystem, appealing to businesses already embedded in Office 365. Both tools offer unique value; your choice depends on individual needs and scenarios.
Let's take a deeper dive now to clearly understand their advantages and differences in key categories.
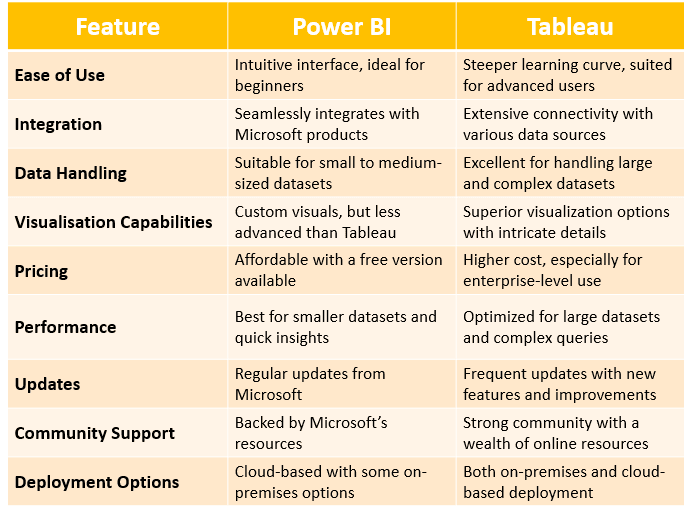
Detailed Feature Comparison: Tableau vs Power BI
Data Connectivity and Sources
Modern businesses handle massive amounts of data from various sources. Connecting these data sources seamlessly is critical.
Tableau Strength:
- Integrates easily with various databases such as SQL Server, MySQL, Amazon Redshift, Snowflake, Google Cloud.
- Robust proprietary connectors and APIs for efficient ETL processes.
Power BI Strength:
- Exceptional compatibility with Microsoft environment (Azure, SharePoint, Excel).
- Growing number of connectors powered by an active developer community.
Personal anecdote: One client switched from Tableau to Power BI simply for easier Excel and SharePoint integration. Their reporting time decreased by 40%.
Recommended external resource: Check Official Microsoft Power BI Connectors for detailed info.
User Interface and Ease of Use
Tableau Interface:
- Simplified, drag-and-drop visuals appeal to non-technical users.
- Clean, intuitive approach prioritizing visuals over complexity.
Power BI Interface:
- Familiar Microsoft Office-style interface intuitive for Office users.
- Slightly busier interface but highly efficient once accustomed.
Recommendation: If your team is used to Excel and PowerPoint, Power BI will feel more natural. However, Tableau will help teams unfamiliar with these environments adapt quickly to analytics tasks.
Visualizations and Dashboards
Tableau Dashboarding:
- Exceptional visualization quality, interactivity, and flexibility.
- Superb graphic detail ideal for executive presentations.
Power BI Dashboarding:
- Rich dashboards with seamless Microsoft integration (Teams, Excel).
- Customization steadily improving, though slightly limited compared to Tableau.
Anecdotal Insight: Tableau dashboards often impress board meetings immediately, while Power BI is efficient for everyday monitoring and analysis.
Analytics and Machine Learning Features
Tableau Analytics:
- Excellent built-in predictive analytics and forecasting modules.
- Simple integration with Python and R.
Power BI Analytics:
- Leverages Azure Machine Learning for robust analytics.
- Deep built-in ML via DAX calculations.
Advice: For large-scale machine learning deployment, Power BI integrated with Azure is highly recommended. Tableau is preferable for smaller, agile projects focused on immediate visualization impact.
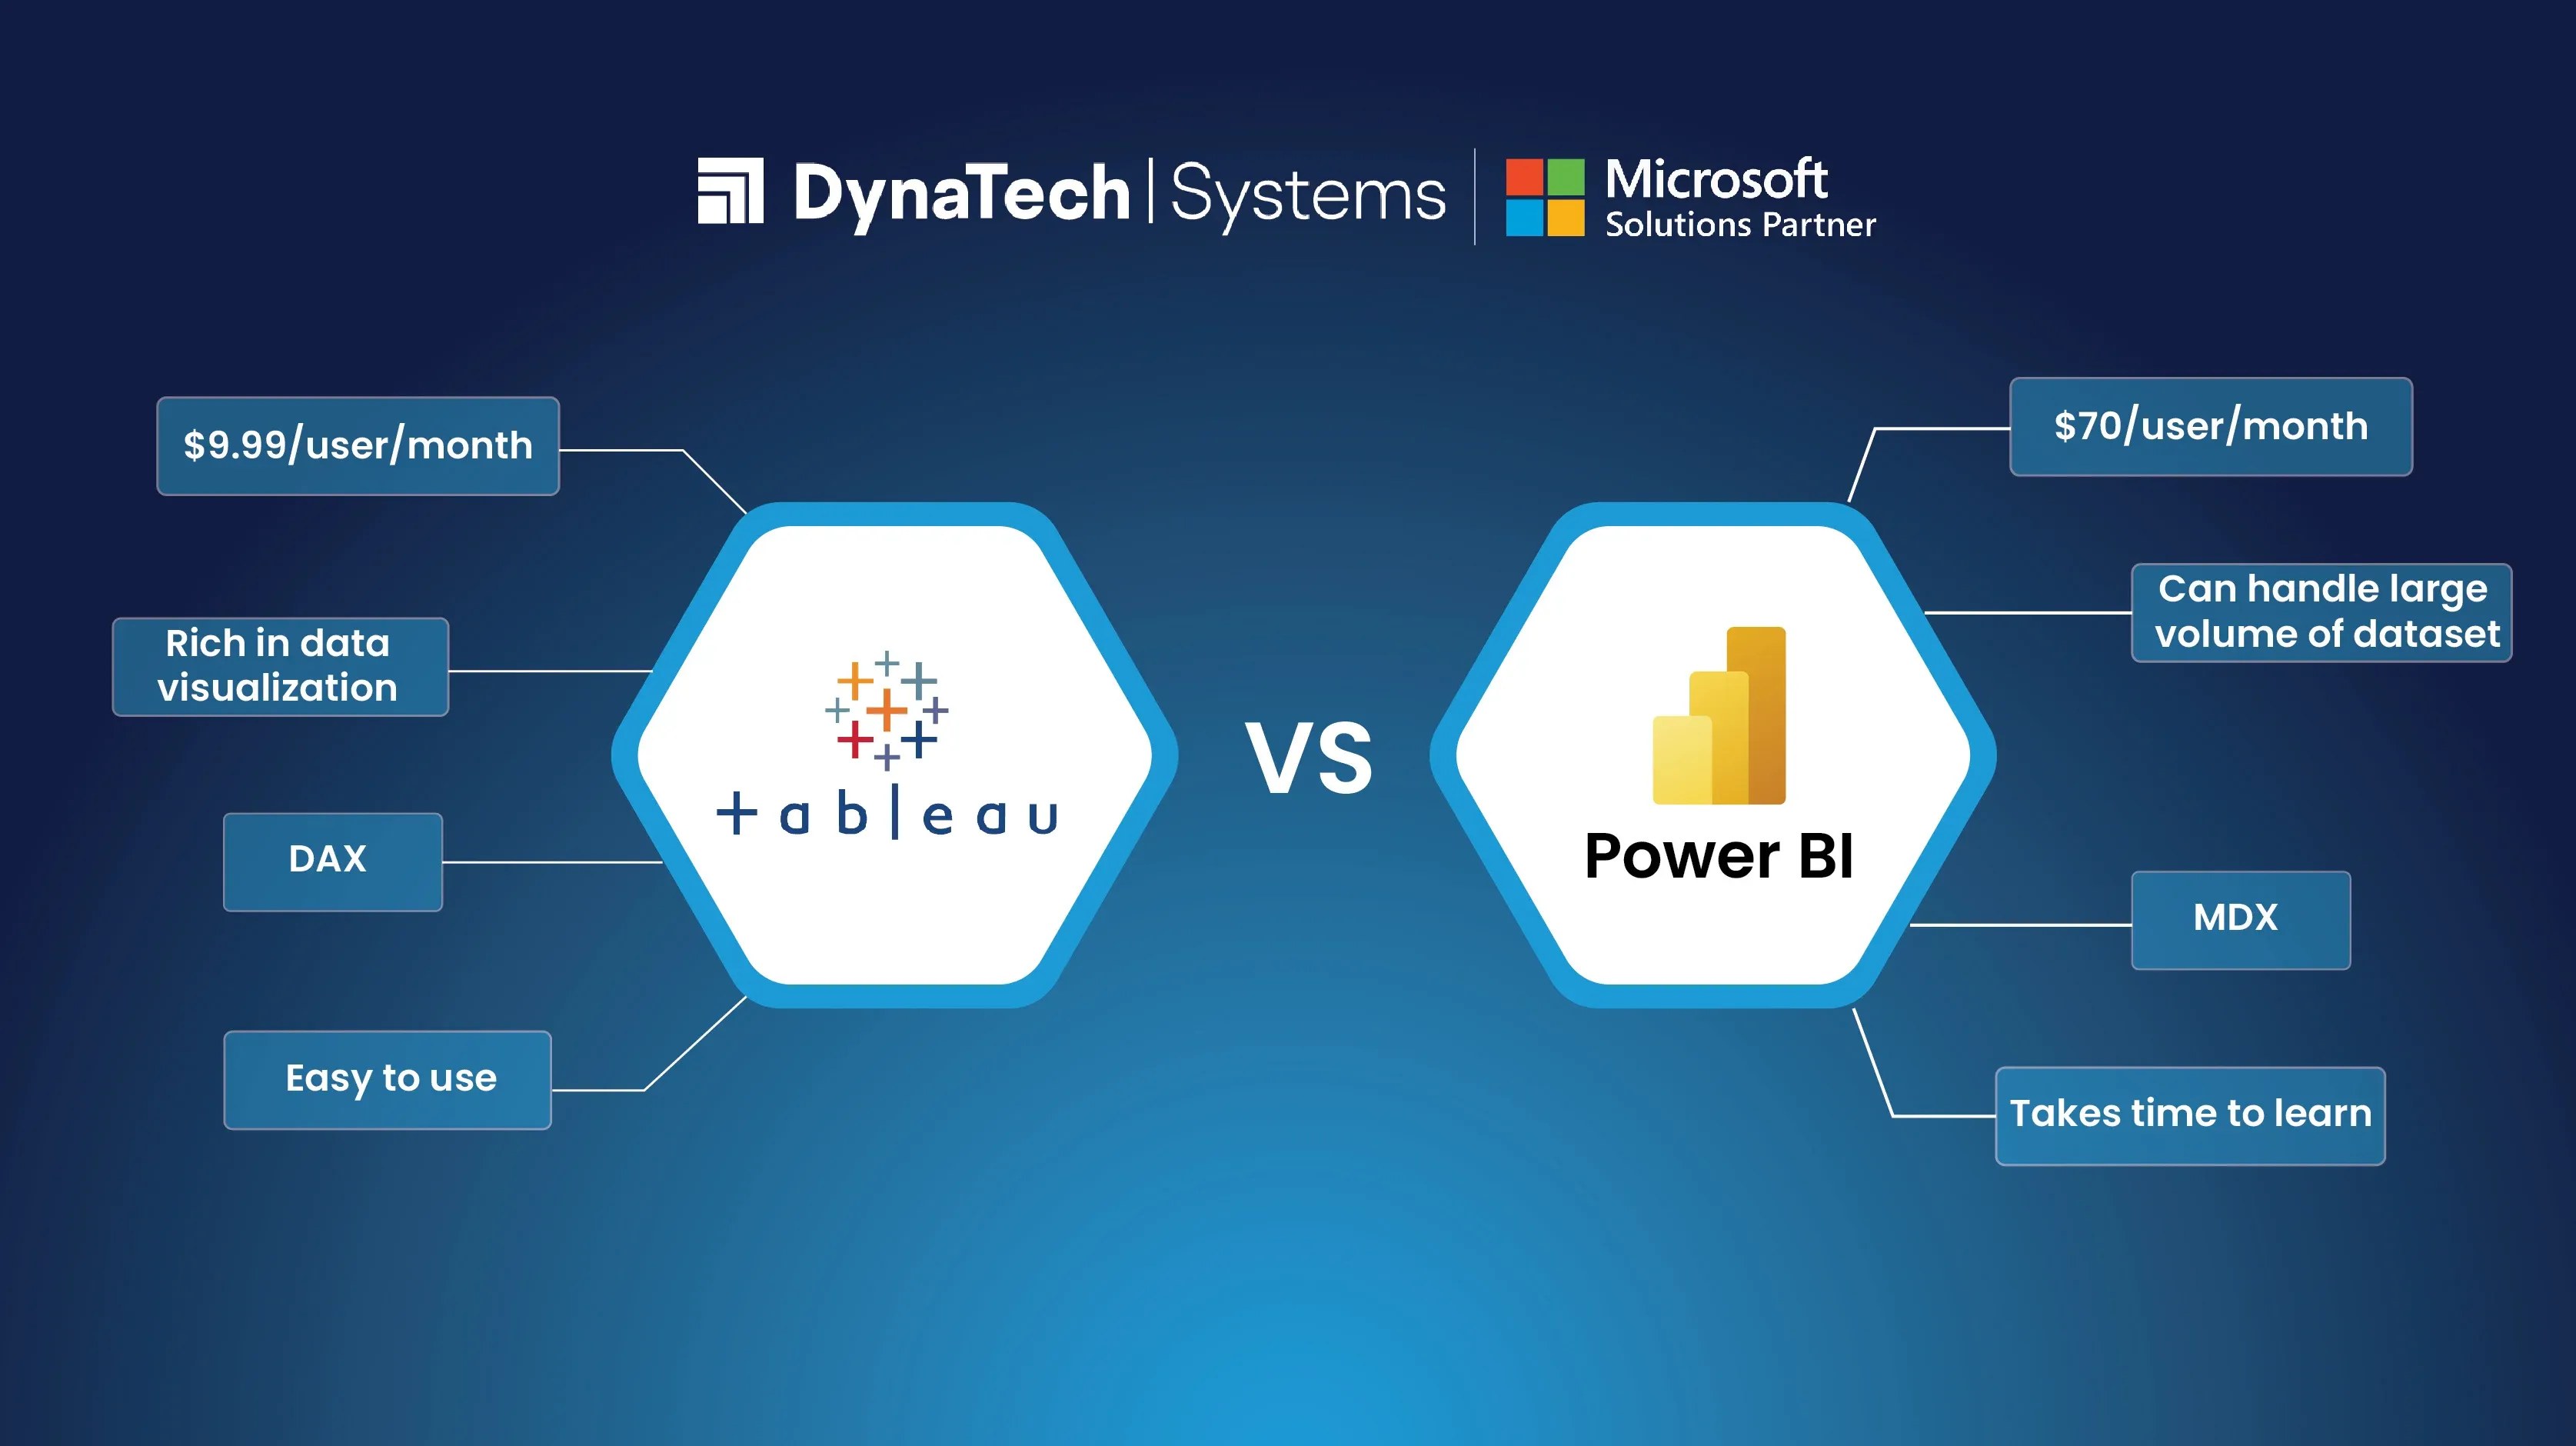
Pricing Structure Analysis: Tableau vs Power BI
Understanding Costs and Pricing Models
- Tableau Pricing: Primarily user-license based; sometimes significant upfront costs.
- Power BI Pricing: Affordable monthly subscription; free version limits capabilities but great for initial evaluation.
Consult Tableau Pricing and Power BI Pricing for latest 2025 updates.
Which Offers Better ROI?
The choice depends highly on business size and complexity. For rapidly expanding enterprises, Tableau usually shows great ROI in long-term flexibility. Power BI shows exceptional quick ROI for SMBs embedded in Microsoft.
Community and Support Availability: Tableau vs Power BI
Educational Resources
Both tools provide excellent free training:
Support and Community Engagement
Tableau Community:
- Active forums & Tableau Public for inspiration and templates.
Power BI Community:
- Dynamic, rapidly-expanding community networks, mostly Microsoft Certified experts and MVPs.
Personally, I found community engagement paramount when encountering complex issues—both are stellar, with Tableau slightly edging in rich visualization diversity.
Real-World Use Cases: Tableau vs Power BI
Case Study in Small Business Environment
A small e-commerce business increased sales visibility significantly using Power BI's integration with Shopify and Excel, reducing monthly reporting timelines from two weeks to two days.
Enterprise-Level Implementation
A multinational FMCG company leveraged Tableau to integrate millions of records from multiple global databases, creating actionable insights instantly accessible to stakeholders worldwide.
Final Verdict: Tableau vs Power BI - Choosing Your Ideal Solution
Here’re final personalized recommendations to help you make the best choice for your business in 2025:
-
Choose Power BI if:
- Your business primarily employs Microsoft products.
- Budget considerations and quick setup are essential.
- You foresee extensive leveraging of Azure and advanced Microsoft cloud features.
-
Choose Tableau if:
- Flexibility, innovative visualization capacity, and detailed, custom dashboards are your priorities.
- You handle diverse databases and complex visualization requirements.
- Budget permits higher initial investment for deeper analytics and expansive customization.
In essence, neither tool universally surpasses the other. Evaluating your unique business requirements upfront will lead to a wiser solution for your scenario.
Hopefully, this comprehensive Tableau vs Power BI guide addresses your every query. Don’t hesitate to dive deeper with the resources provided and take advantage of free trials to ensure your final pick aligns perfectly with your business goals.
Understanding the particular strengths and limitations pointed out above can significantly aid in making an informed decision, and ultimately, drive your business analytics to new heights.